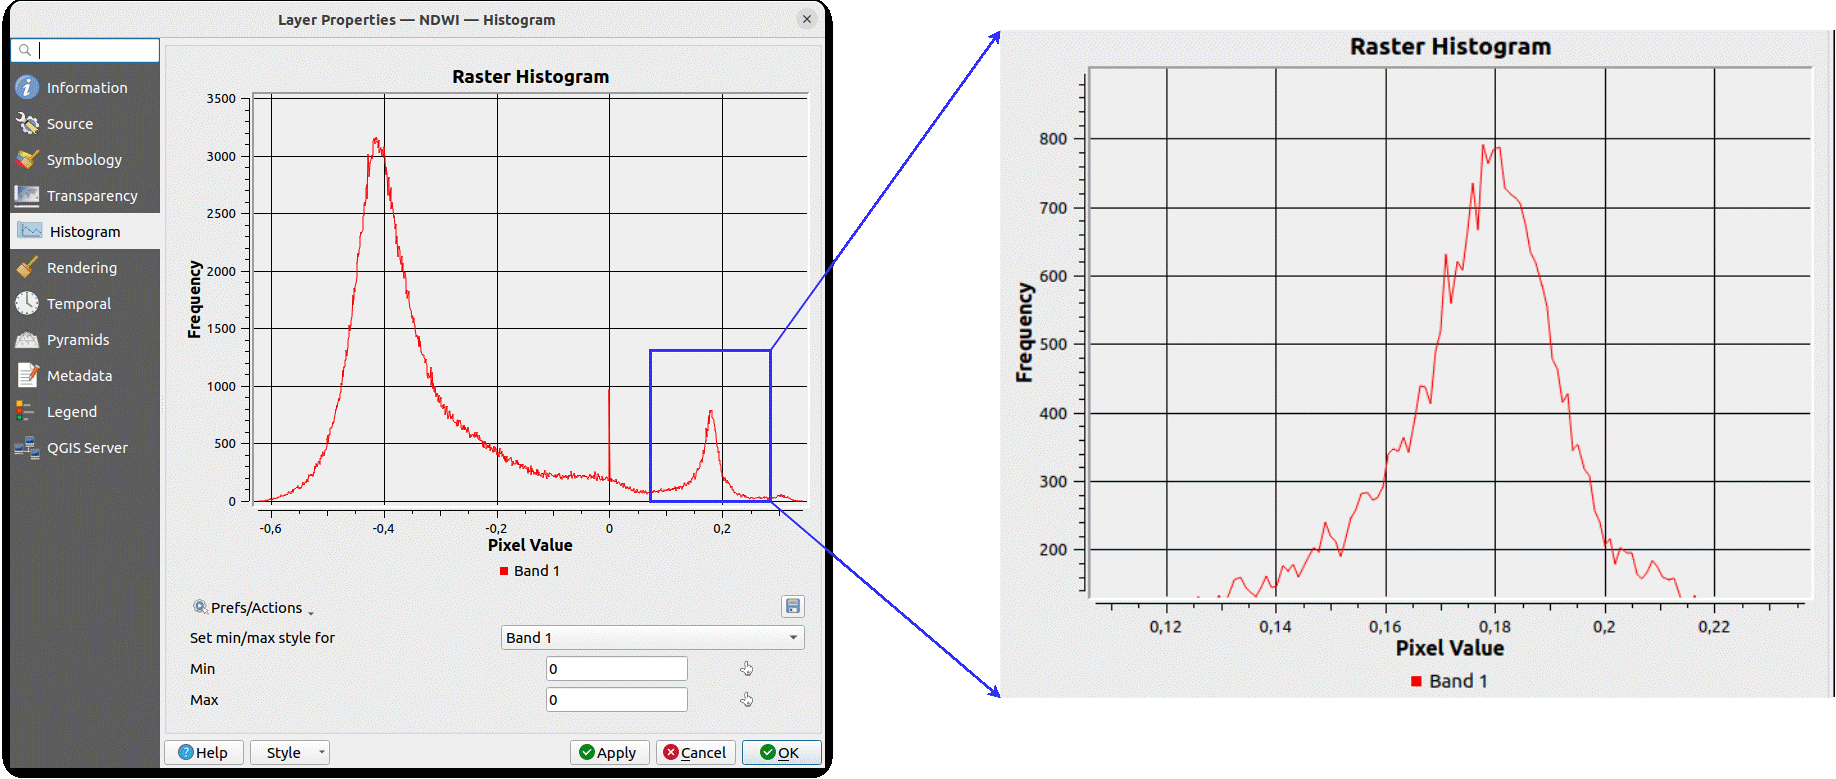
Figure 15 Raster values histogram and a zoom in to the peak representing water.gif
 1
1
Links
- https://www.zfl.uni-bonn.de/font-families/using-optical-data-to-map-floods/figure-15-raster-values-histogram-and-a-zoom-in-to-the-peak-representing-water.gif/image_view_fullscreen
- https://www.zfl.uni-bonn.de/font-families/using-optical-data-to-map-floods/figure-15-raster-values-histogram-and-a-zoom-in-to-the-peak-representing-water.gif/@@download/image/Figure 15 Raster values histogram and a zoom in to the peak representing water.gif